Debugging Jupyter Enterprise Gateway
This page discusses how to go about debugging Enterprise Gateway. We also provide troubleshooting information on our Troubleshooting page.
Configuring your IDE for debugging Jupyter Enterprise Gateway
While your mileage may vary depending on which IDE you are using, the steps below (which was created using PyChar as an example) should be useful for configuring a debuging session for EG with minimum adjustments for different IDEs.
Creating a new Debug Configuration
Go to Run->Edit Configuration and create a new python configuration with the following settings:
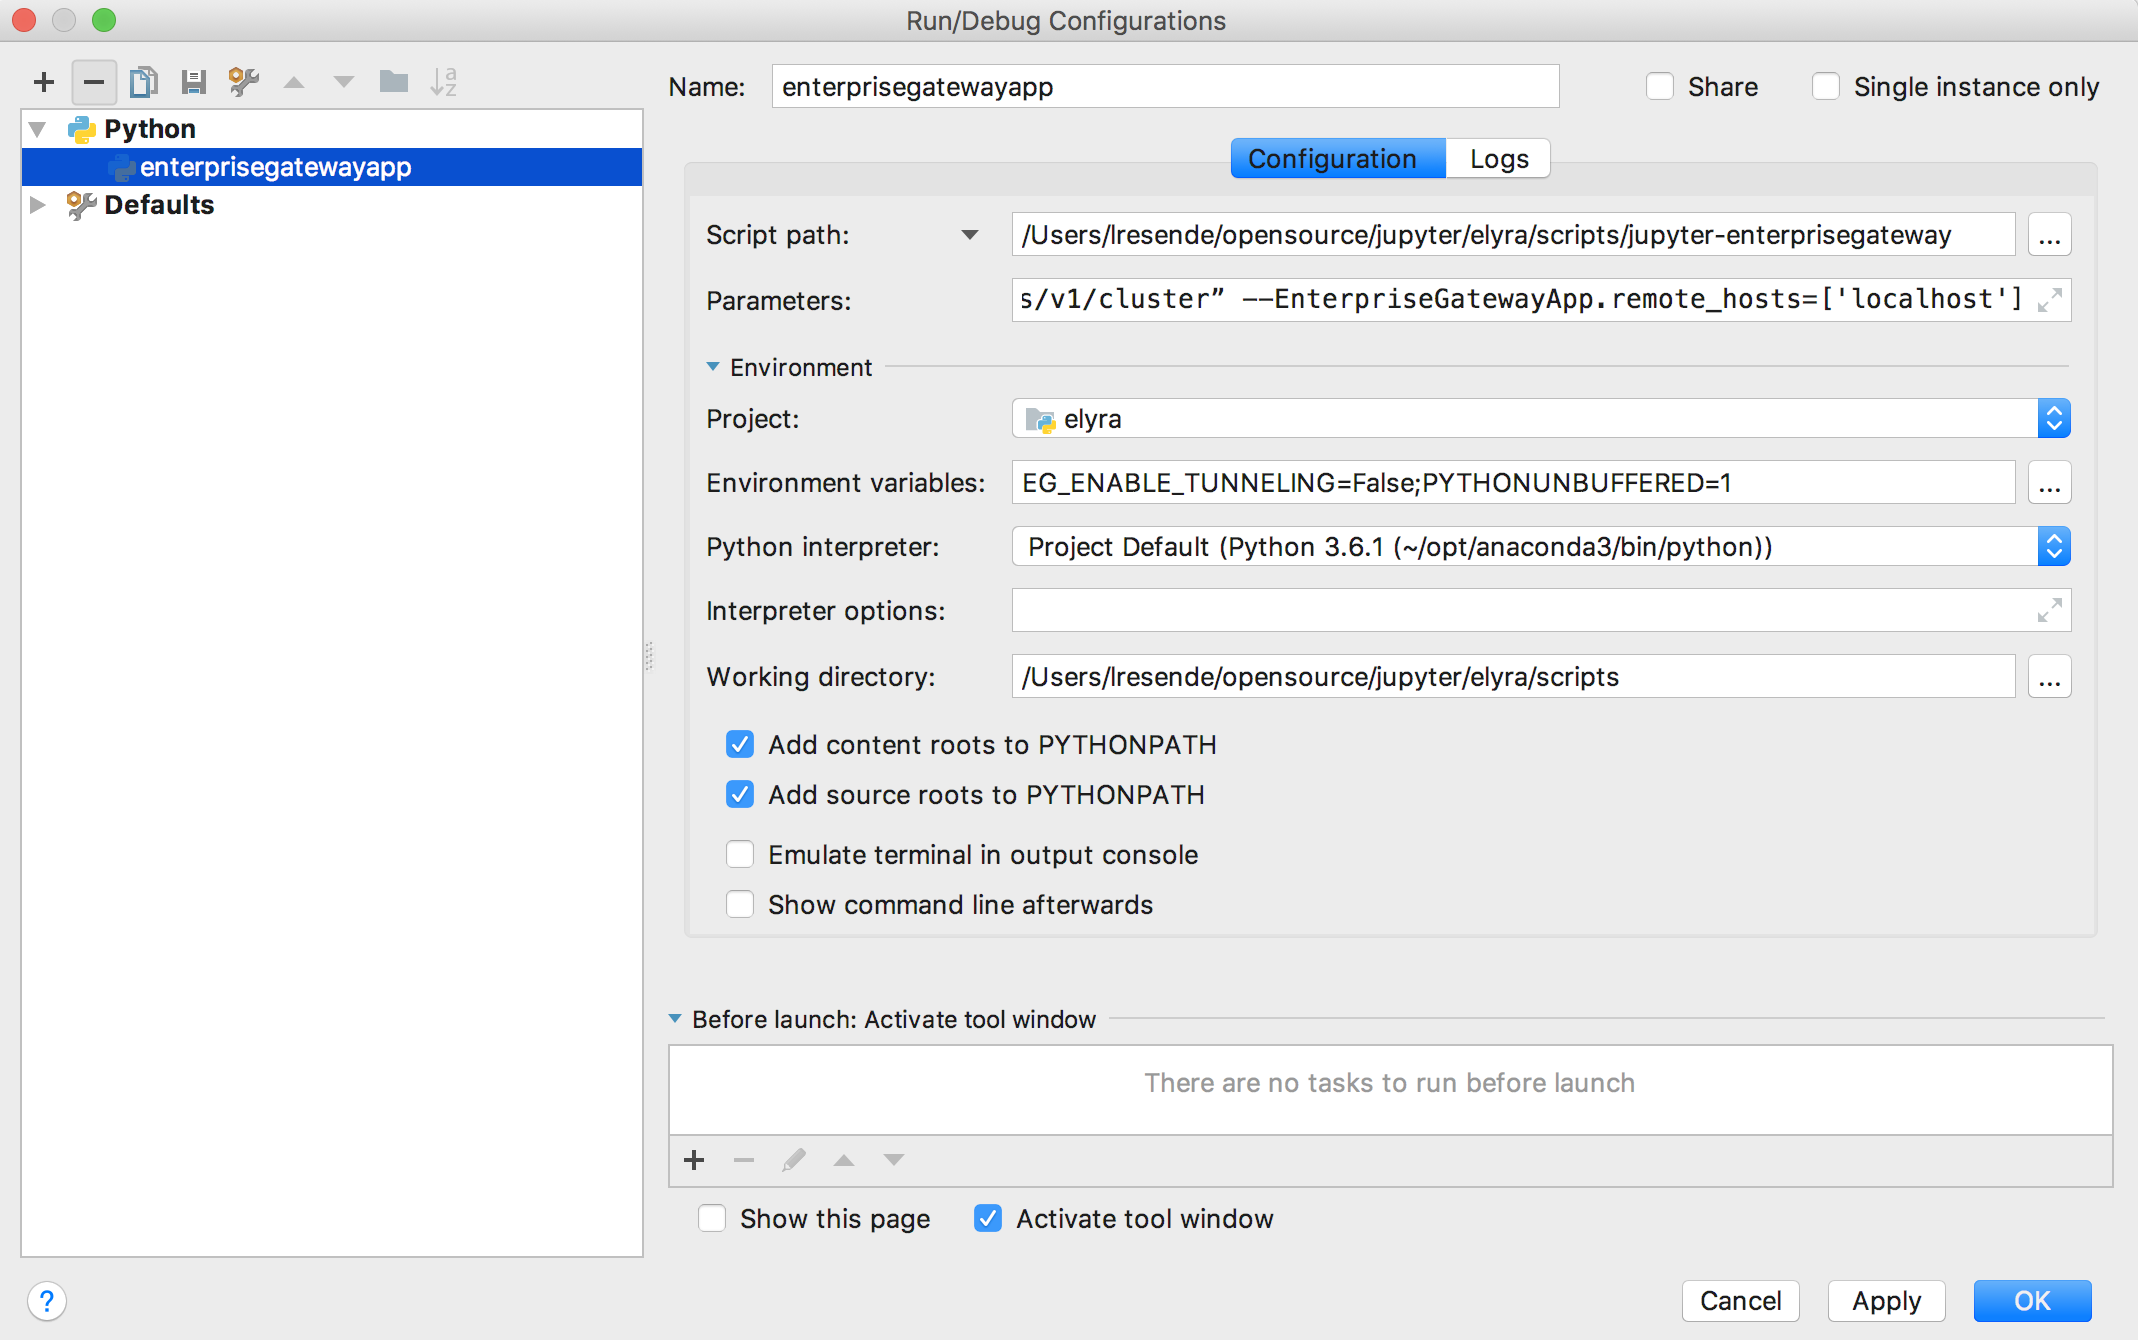
Script Path:
/Users/lresende/opensource/jupyter/elyra/scripts/jupyter-enterprisegateway
Parameters:
--ip=0.0.0.0
--log-level=DEBUG
--EnterpriseGatewayApp.yarn_endpoint=“http://elyra-fyi-node-1.fyre.ibm.com:8088/ws/v1/cluster”
--EnterpriseGatewayApp.remote_hosts=['localhost']
Environment Variables:
EG_ENABLE_TUNNELING=False
Working Directotry:
/Users/lresende/opensource/jupyter/elyra/scripts
Running in debug mode
Now that you have handled the necessary configuration, use Run-Debug and select the debug configuration you just created and happy debuging.